In 2019 the average spent on logistics was approximately 11% of sales, representing a significant portion of total expenses. For this reason, organizations are regularly looking for ways to optimize supply chain operations, to reduce related expenses and increase the amount of value created through logistics operations. As Peter Drucker, who’s considered to be the father of modern management, once said “what gets measured gets improved.” For logistics management, specific supply chain KPIs are used to objectively measure progress towards improvements.
Real-time transportation visibility platforms provide access to accurate and reliable data that directly feed into several top supply chain KPIs. What’s more, the implementation of real-time transportation visibility platforms also allows for many productivity and efficiency gains to improve KPI scores.
Here are the top 7 supply chain KPIs that RTTV platforms help to improve:
1. On Time In Full % (OTIF, level of service)
Simply put, this metric measures whether a shipment from a distribution center has been delivered to the customer within the agreed timeframe and in the correct quantity. This is essentially the service level that the customer observes so is considered one of the most important logistics KPIs.
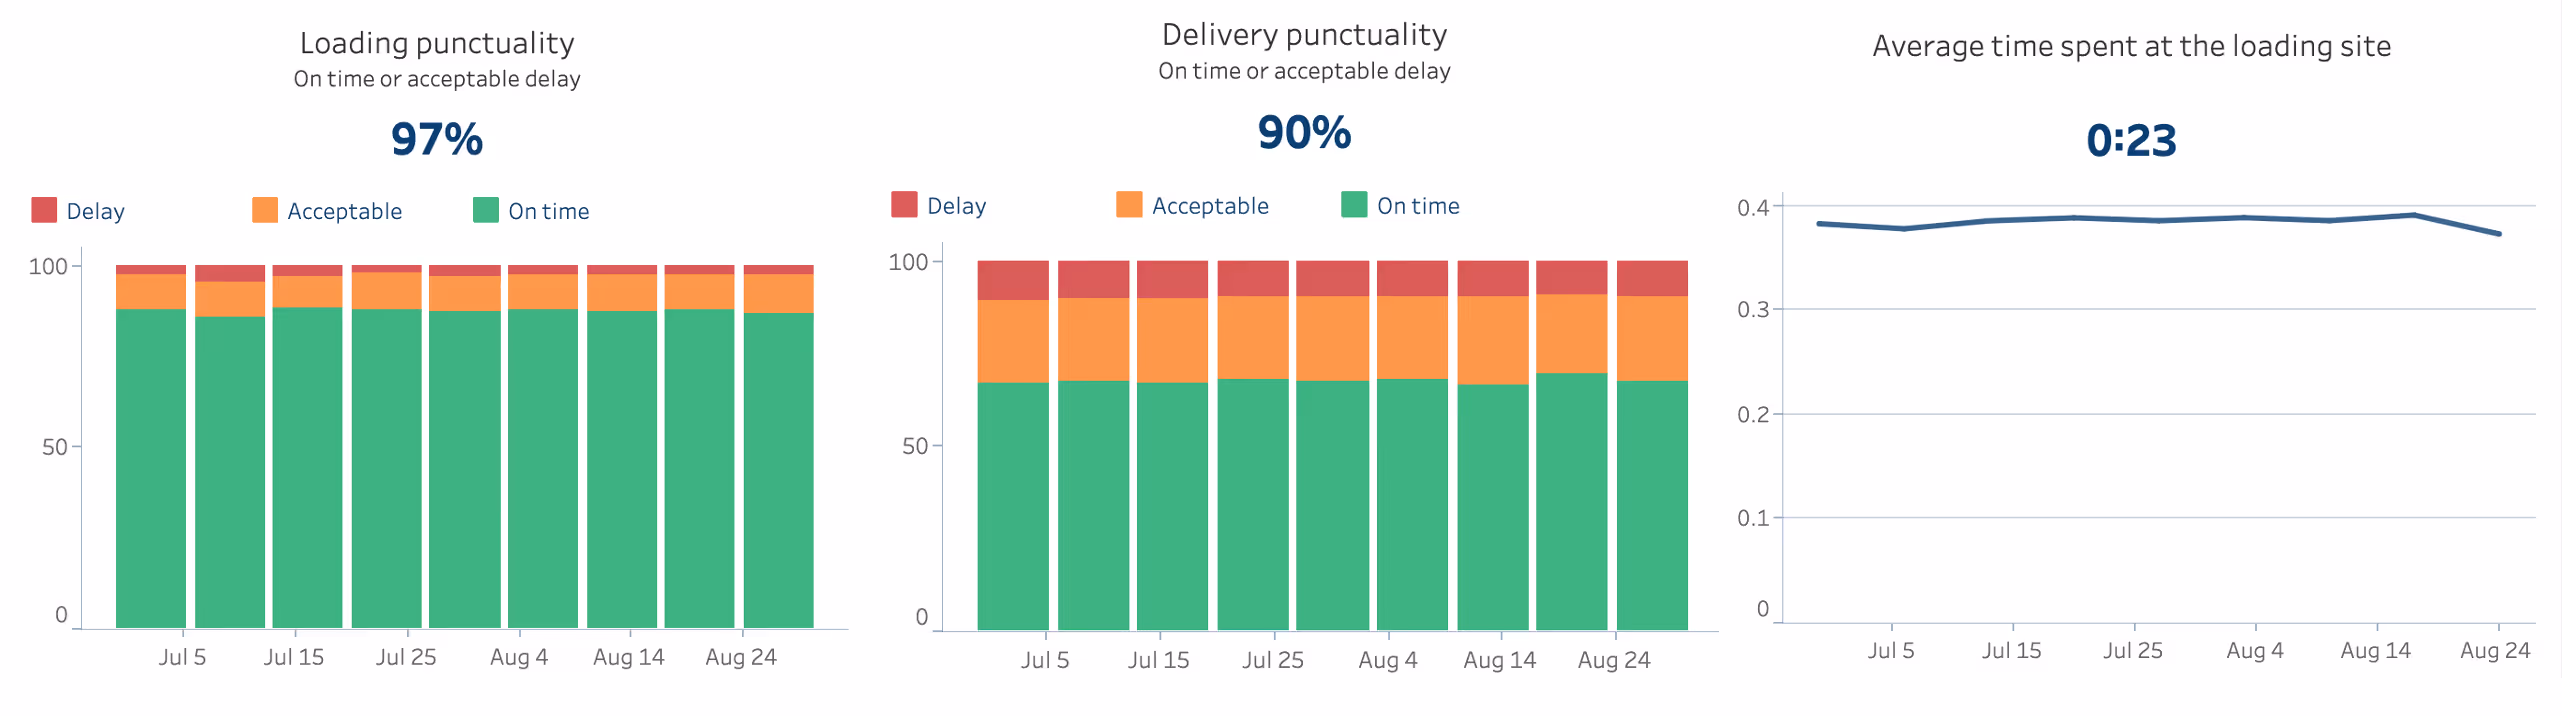
2. Punctuality of orders
Similar to OTIF, but the focus is wider than a single order/shipment. This KPI measures the number of orders delivered on time divided by the total number of orders. A high rate demonstrates an efficient supply chain.
3. Punctuality of transport
The degree to which a transportation vehicle is adhering to its delivery schedule. About 25% of deliveries arrive more than two hours before their scheduled delivery appointment, which often results in inefficiencies caused by idling trucks.
The first three KPIs relate to timing. If a shipment arrives too early, it can mean additional storage costs for the shipper. If too late, it could result in penalties and dissatisfied customers and other knock-on effects downstream. Combined with the ability to track shipments down the unit or SKU level, the precise location data collected and filtered by a RTTV solution, as well as eCMR generation, allow for greater objectivity when measuring punctuality and OTIF performance. Automated notifications give advance warning of delays to end-customers to help manage expectations and potentially avoid penalties. For example, dock slots may be able to be rebooked without incurring additional cost.
4. Productivity ratio
The number of cartons or pallets prepared each day per employee within a warehouse or distribution center.
5. Amount of extra warehouse costs
The overtime worked by warehouse staff to keep operations running smoothly.
The 4th and 5th KPIs relate to warehouse operations, which can be greatly streamlined with the help of RTTV solutions. Accurate delivery ETAs allow for dynamic slot bookings, which reduce idle time for truck drivers and reduce the number of wasted hours for loading and operations staff. Access to online portals and real-time status notifications reduce the need for staff to follow up on late inbound or outbound deliveries via phone or email, allowing them to focus on value-added tasks.
6. Rotation rate
The number of deliveries made per day. In a sector such as retail, around 3 to 4 per day is considered a good rate for example.
7. Carbon footprint
The amount of CO2 emissions from transportation of goods per km travelled or per unit shipped.
Both rotation rate and carbon footprint can be improved through route optimizations which require feeding historic transportation data into sophisticated tools and algorithms to produce models. RTTV platforms ensure the data collected is highly accurate and reliable. The availability of such data in real-time also allows these optimizations to be made dynamically, helping to keep rates low and improve KPI scores.
A single source of truth for measuring achievement of supply chain KPIs
The true power of RTTV platforms is their ability to not only collect and process but to also surface this objective data in a portal, as a single source of truth, and present actionable insight. The ability to see real-time progress for various KPIs gives decision-makers greater levels of insight and confidence.
Discover how Shippeo’s real-time transportation visibility platform can help you better monitor and improve supply chain KPI achievement today with a demo carried out by one of our experts.
Latest blogs & product releases.
Authors