Carbon Visibility
Accurate carbon emissions for every shipment
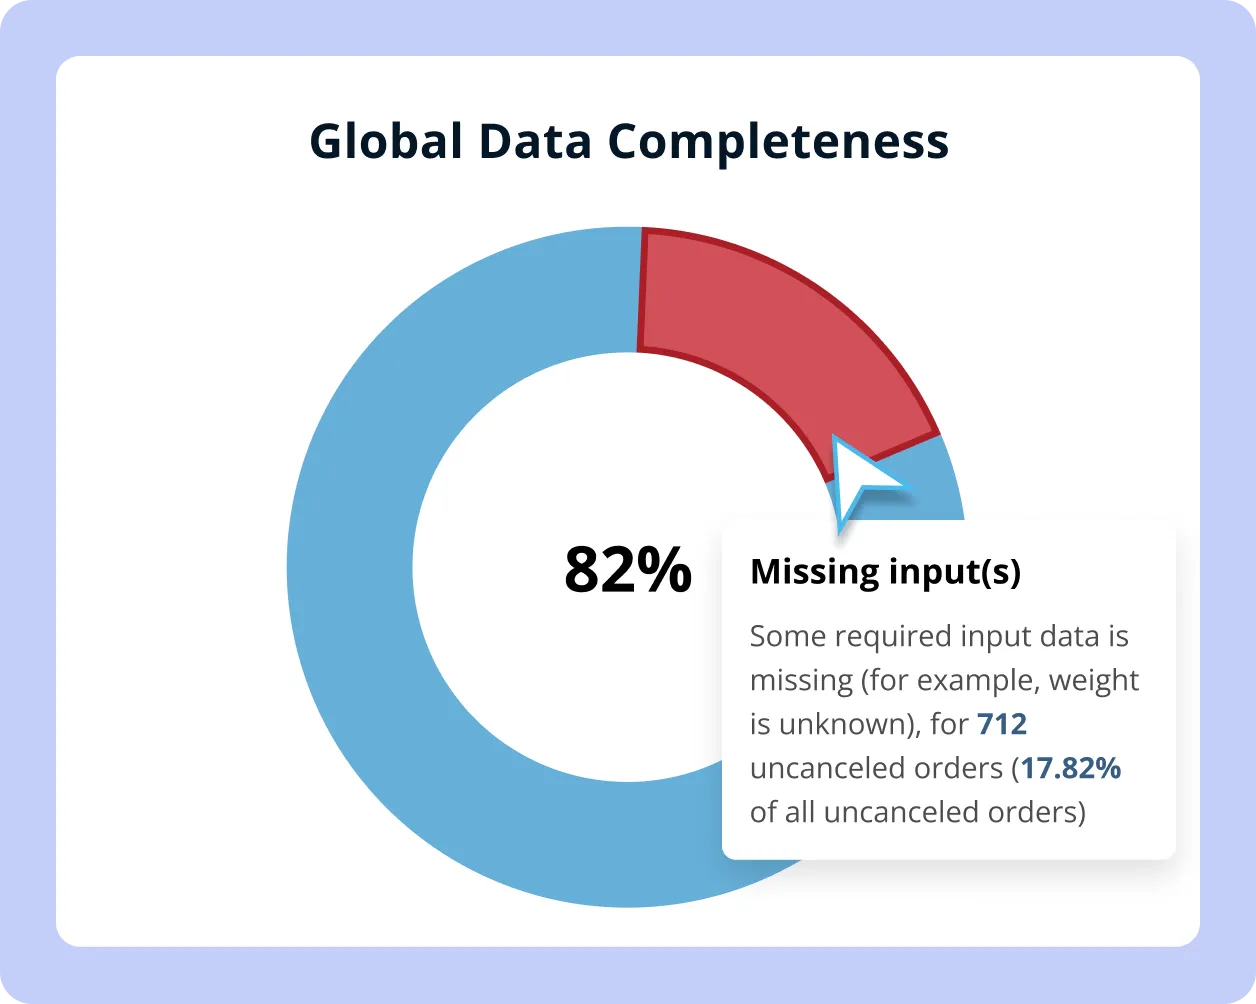
Save time on carbon reporting and make meaningful progress towards your sustainability goals with GLEC-accredited, ISO 14083-compliant calculations, reducing over reporting by up to 73% compared to generic models.
.avif)
No items found.
Calculate carbon footprint precisely
Save time & hassle calculating
emissions
Gain a consolidated view of CO2 emissions across all flows, regardless of mode.
Compare carrier emissions objectively using a consistent framework.
Consumer Goods Industry
"The ongoing innovation in the use of primary data on CO2 emissions positions Mars as a driving force in the sustainability efforts of the logistics industry in Germany. By working with Shippeo, we gain valuable insights to optimize our operations and reduce our transport emissions."
Björn Schlenker
Supply Chain Director, Mars
Read more reviews